In behavioral studies, we want to analyze the locomotion. If we work on a single individual, we can easily obtain the position (x,y) in each frame and calculate the velocity. With multiple individuals, things become extremely hard. When two animals intersected in a frame, how can you tell which is which in the next frame? Here I don’t pursue this issue and simply try to obtain the spatial distribution of the individuals in each frame.
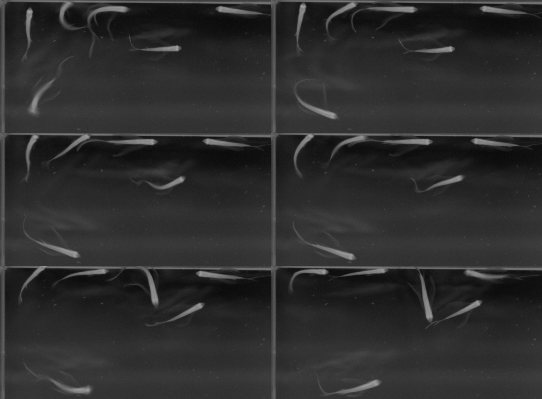
Shown above are adult zebrafish. It is not essential whether the animal appears white on black background or black in white background in the original image because it is easily inverted programmatically. The most important thing is finding the optimal lighting condition that gives the highest contrast to reliably isolate the animals from the background through all the frames. Thus, optimization of the lighting condition and image processing may be better done in parallel.
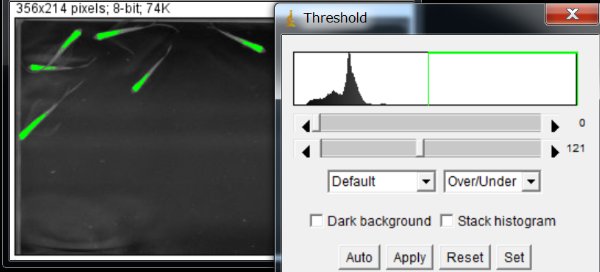
Anyway, let’s separate the animals from the background by thresholding.
Click “Apply” at the thresholding value that gives no background noise. The value of 121 worked well with this particular example.
Let’s check the area of the individual fish.
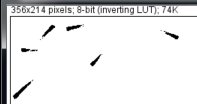
First, Edit > Invert, (fish appears black with the value of 255, background appears white with 0),
then, Analyze > Set Measurements > check “Area“, “Center of mass“, and “Shape descriptors“, and run Analyze > Analyze Particles…
In this example, the fish areas were 82, 84, 72, 45, 65 and 127 pixels with the circularity of approx. 0.4. We will use theses numbers (thresholding, area, cirularity) in the following.
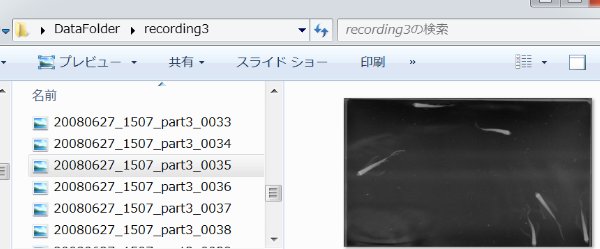
Now, let us suppose that we made several behavioral recordings and in each recording the image data were saved as sequentially numbered JPEG files.
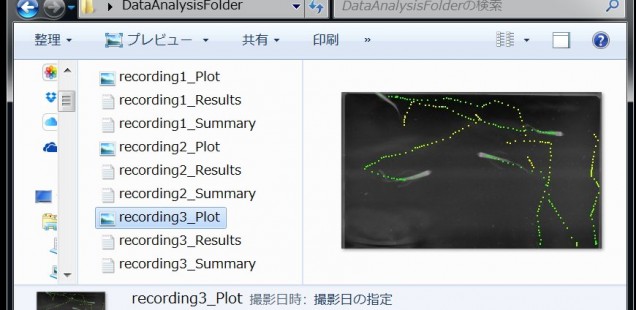
I made an ImageJ macro that will automatically import the sequential JPG files, do Particle Analysis to calculate center of mass, plot it on an image, and save the results in a folder. The macro is just a text file and should work both on Windows and Mac OS.
In the macro, you need to use your own values for setThreshold and Analyze Particles.
///////////// Make binary images. You need to use your own values for Threshold.
selectImage(rowimage);
setThreshold(0,121);//Use your own values for your image data
run(“Make Binary”, “method=Default background=Dark thresholded remaining black”);///////////// Particle analysis. You need to use your own values for the Size and Circularity
run(“Invert”, “stack”);
run(“Set Measurements…”, “area center shape redirect=None decimal=3”);run(“Analyze Particles…”, “size=30–160 circularity=0.2–1.00 show=Masks display clear summarize stack”);
Results files contain center of mass (XM, YM) for all particles in the movie, without information about in which frame the particles were found. “Summary of ..” files contain the information about how many particles (Counts) were detected in each frame (Slice).
What this macro does is simply particle analysis. So, I think it can be used in the study of other animals such as zebrafish larvae, paramecia, Drosophila larvae, C. elegans, etc.
