Here is what I would do to plot calcium signals from multiple neurons after time-lapse imaging. The brain images (GCaMP fluorescence) were acquired using an ORCA camera and an image acquisition software HCImage (Hamamatsu Photonics) ans saved as .cxd format. I copy the image data files to my laptop PC where I use Fiji to look at the data. Fiji is just ImageJ with many useful plugins pre-bundled (http://fiji.sc/Fiji).
1. Opening the movie file
On the ImageJ(Fiji) menu, choose File > Open .. , and select your movie file. Bio-Formats plugin will figure out the image format.
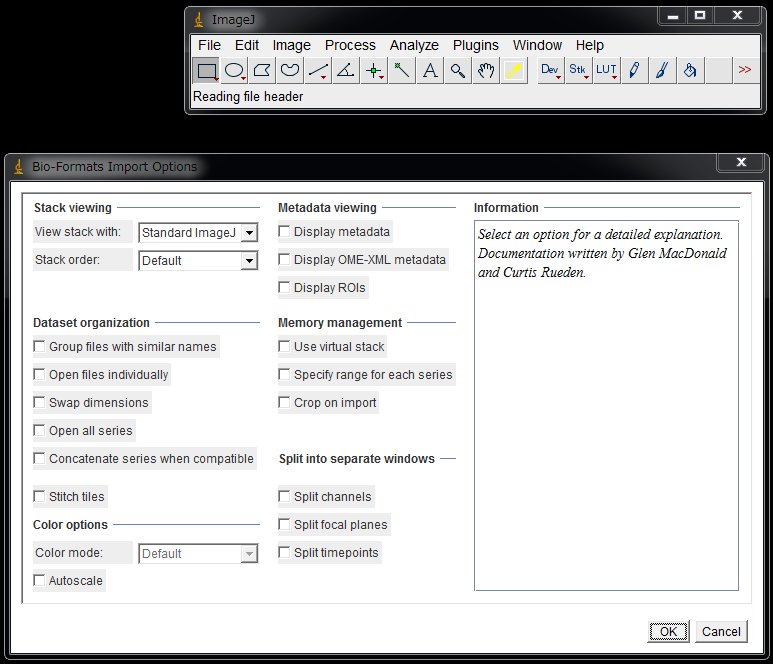
Simply click “OK”. It takes a while for a large-sized file. The entire image may appear as black.
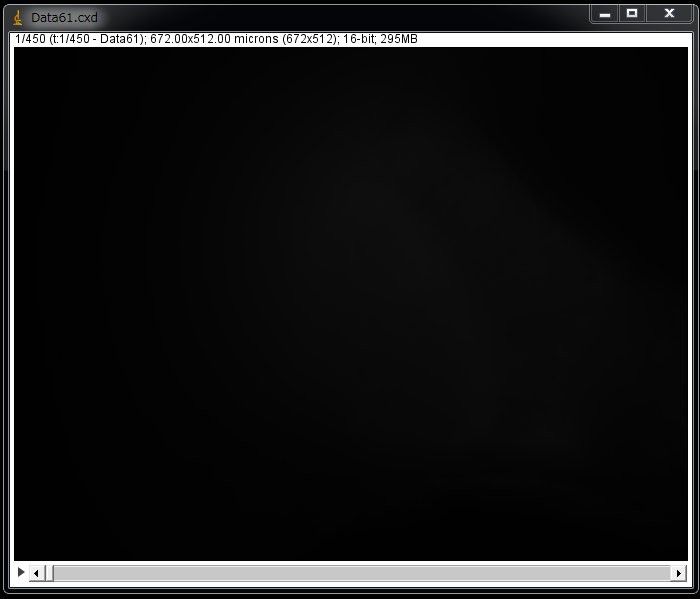
This is simply because the image contained only low pixel values whereas the camera took images with a bit depth of 16-bit (0-65535). In the case of 12-bit, the values can be 0-4095.
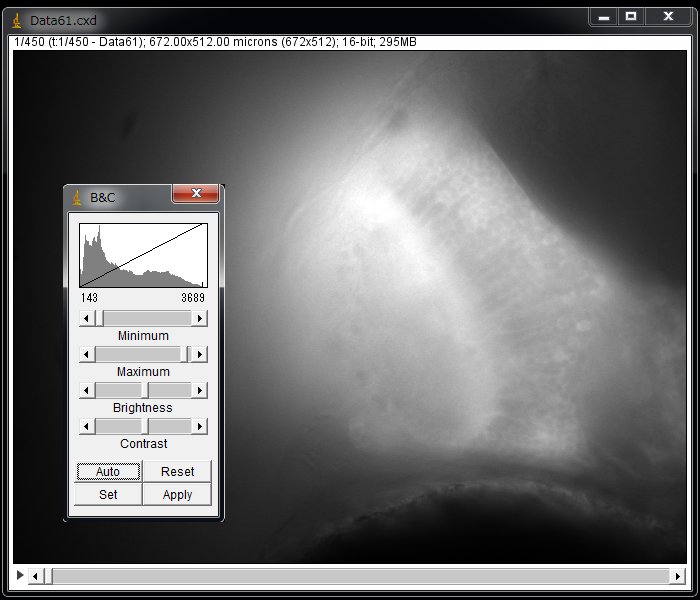
From the menu, choose Image > Adjust > Brightness/Contrast… > Click “Auto” in the B&C panel. Now you see the image.
2. Identification of the responded cells
To see which cells responded, you can grab and move around the slider on the bottom or replay (right click the play button to set the appropriate replay speed) of the movie. Another way is to calculate the deviation through all frames. To do so,
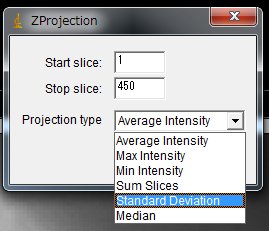
On the ImageJ menu, Image > Stacks > Z Project …
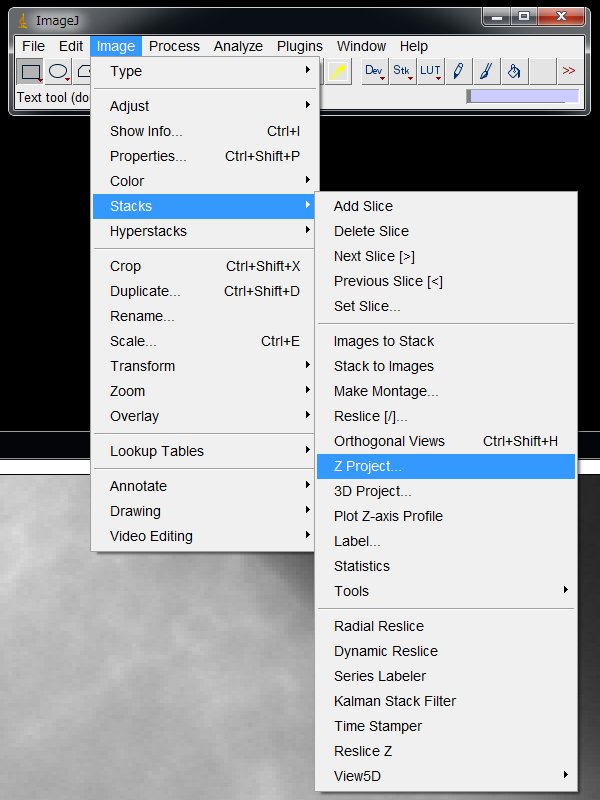
and choose in the pull down menu,
Projection type:Standard Deviation, Click “OK”
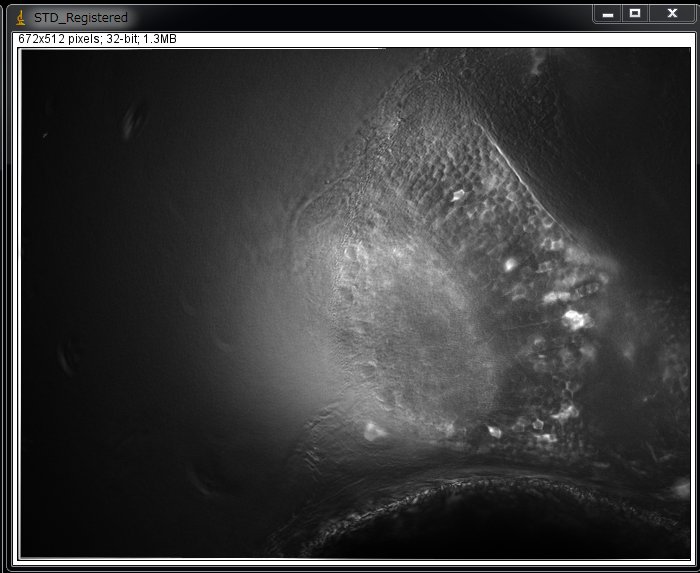
Now you will see pixels whose value fluctuated most (use Brightness/Contrast… to optimize the contrast. ).
3. Image registration
(See another post:Image registration using TurboReg)
If the larva moved during recording, it becomes difficult to reliably obtain pixel values through frames. In that case we need to register the images. Fiji offers many options for image registration (Plugins > Registration ) but I will not go into it for now. If the movement was slight enough, you may skip image registration.
When the drift of the sample cannot be ignored, the simplest solution is just to give up on the data and work on another data in which it did not move, or work only on the frames where it did not move (Image > Duplicate… > Range:XXX-XXX).
Often times, problems that arise in the image processing can be solved or avoided by optimizing experimental conditions. For example, next time you do the recording, use the higher dose of tubocurarine to completely paralyze the fish so that it cannot move at all during imaging.
The image shown above is actually a processed image after image registration (using TurboReg). In this particular example, the drift was partially suppressed.
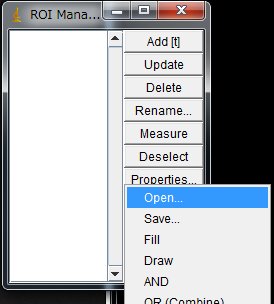
4. Setting multiple ROIs using ROI Manager
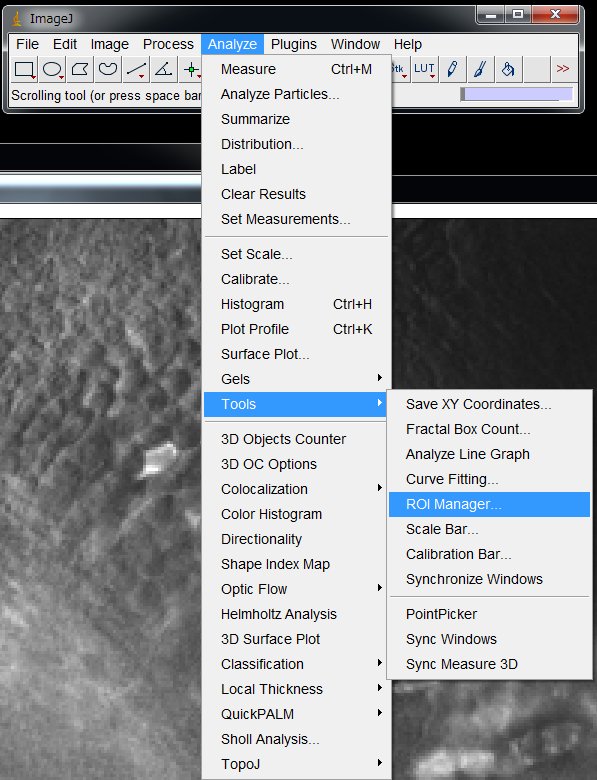
Now, let’s set ROIs (Region Of Interest) on the cells that responded. On the menu, choose
Analyze > Tool s > ROI Manager …
Click the icon of your choice for the ROI shape (e.g., Oval, or Freehand)
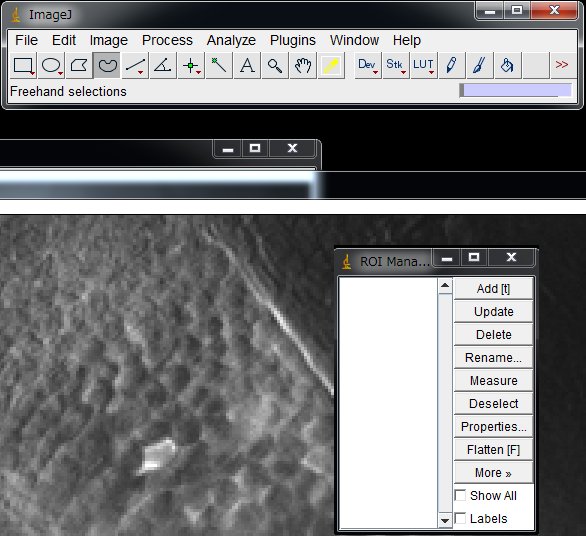
Delineate one cell and click “Add“.
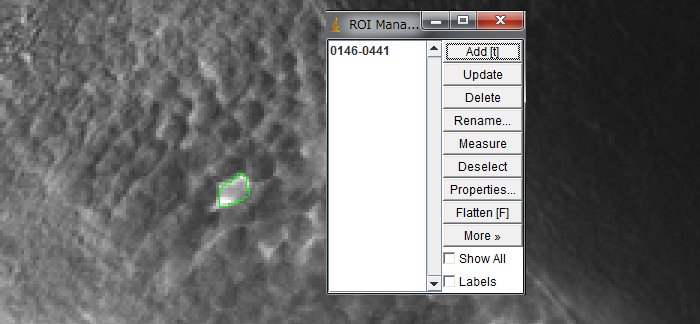
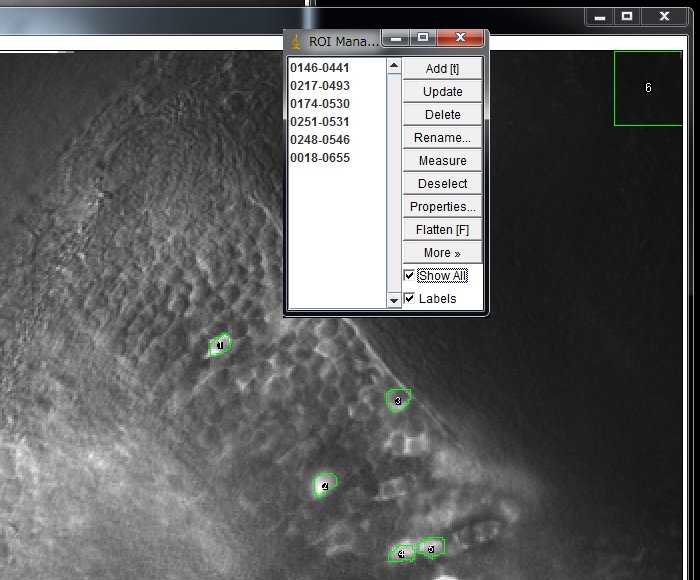
Repeat for all the neurons that you want to measure. Make a ROI for background as well. Click “Show All” to show all the ROIs set. Working on dozens or hundreds of cells is tedious task. Although researcher are trying to make it automatic, it is actually a big challenge. Here, I will set ROIs manually.
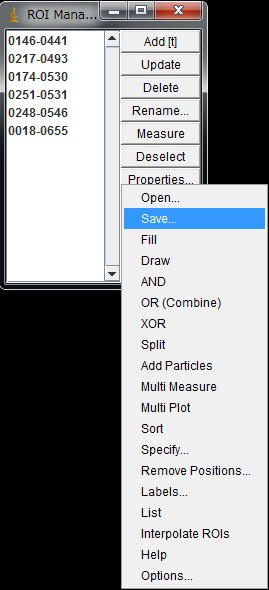
The ROIs can be saved and later loaded to work on other images. In the ROI Magnager window, choose More >> Save … and save with a file name of your choice.
5. Measurement of the mean pixel values
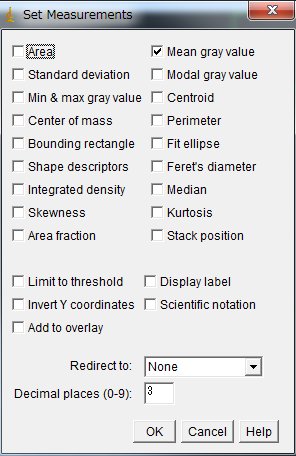
Now, on the menu, Analyze > Set Measurements …
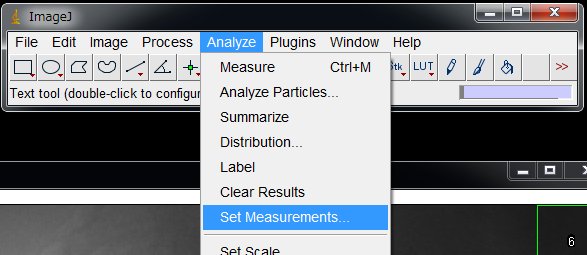
Check “Mean gray value” and uncheck others (unless necessary)
Now we will measure the mean of the pixel values in each ROI. Copy the ROIs onto the movie by clicking the movie window (to make it an window) and clicking “Show All” on the ROI Manager.
Then, on the ROI Manager, choose
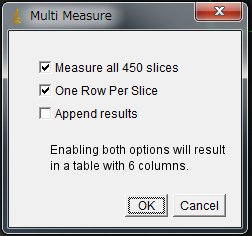
More > Multi Measure > Click “OK”

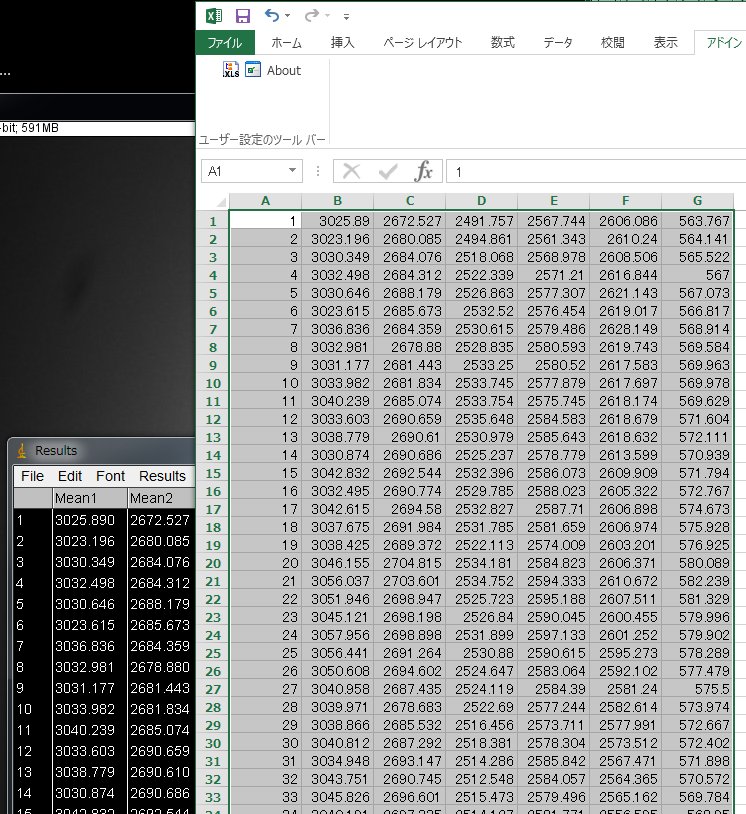
Now Results window will appear. Select All and copy and paste the numbers onto a new sheet in Excel. Column A is the frame numer. Column B to F are ROI1 to ROI5 and Column G is the background.
6. Drawing graphs of the calcium signals in Excel
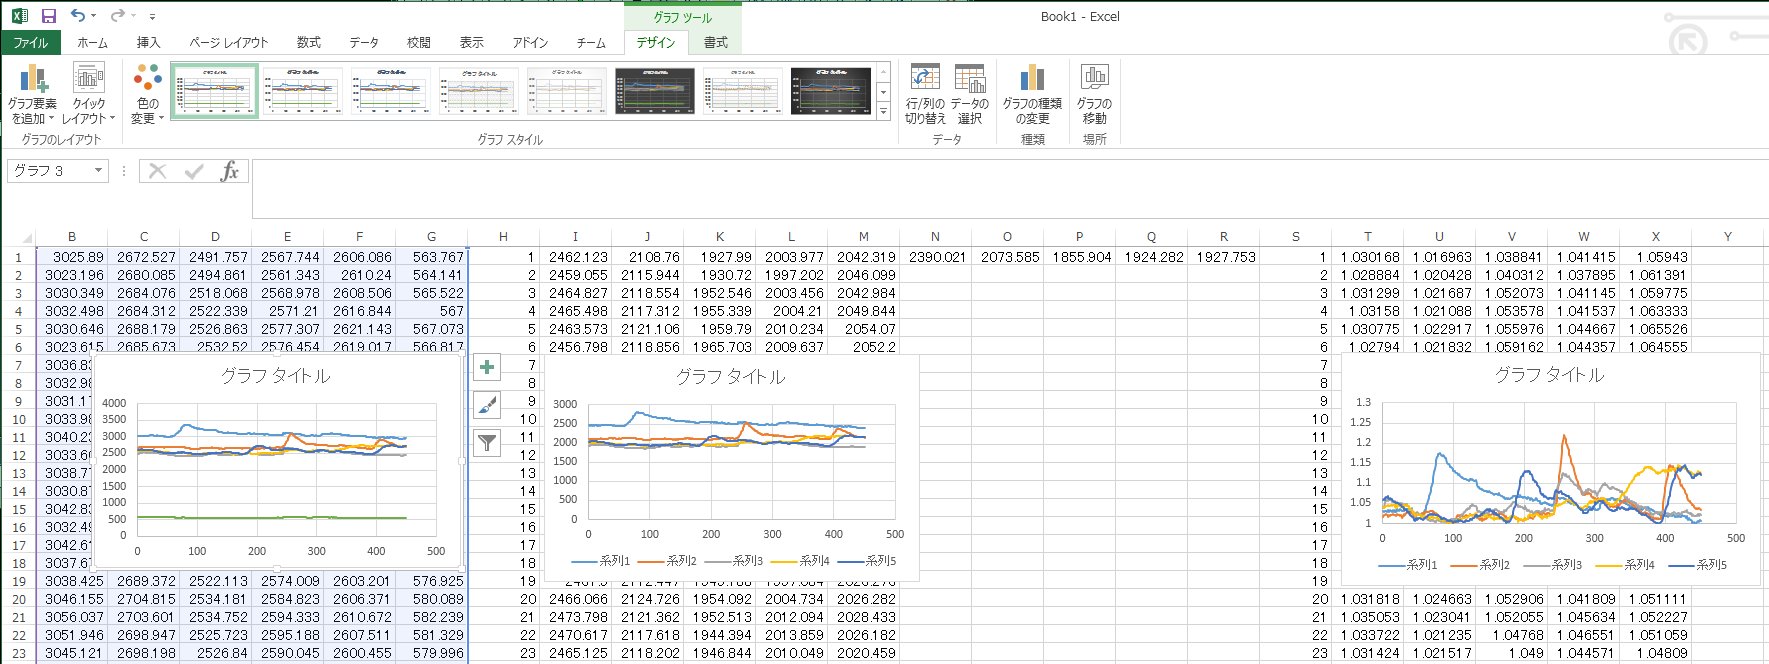
Now we can plot the calcium signals.
First, subtract the background. For I1 on the Excel sheet, the equation is =B1-$G1. The equation can be copied for other ROIs and frames. For example, equation for J1 becomes =C1-$G1, when copied.
Now we want to normalize the signal intensity to basal level and represent the signal as F/F0 (F0 is the fluorescence intensity at basal level). During the recording, we did not give visual stimulus for the first 3 seconds. Therefore, the first 30 frames (images taken at 10 fps) can give the basal level. For example, the equation for N1 can be =AVERAGE(I1:I30). If there happened to be some spontaneous activity in the first 3 sec, then some other period at quiescence may be used, instead.
To obtain normalized signal intensity, the equation for T1 is =I1/N$1 and this equation can be again copied for all other ROIs and frames.
7. Applying the previously saved ROIs to other files
The previously saved ROIs in ImageJ can be loaded and used on another movie as long as the image size and the sample position are the same. In the ROI Manager window, More … > Open … and select the ROI set file.
Refereces
- Muto et al., 2013 Curr Biol paper https://www.cell.com/
current-biology/fulltext/ S0960-9822(13)00002-X - Method section of the above paper. https://www.cell.com/cms/10.1016/j.cub.2012.12.040/attachment/802c0eed-3221-4295-80d6-68512ecbf5b5/mmc1.pdf
Web resources